
Basic Computer System
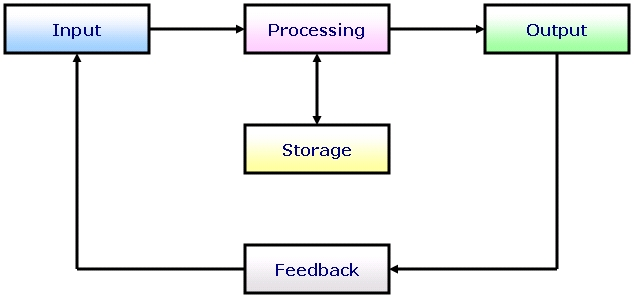
Any basic computer or digital system has input, processing and output elements. The inputs can be buttons or sensors or serial data which are then processed by the code. For the system to be useful, it then needs to generate an output of some kind: serial data, sound, lights or displays.
The LED
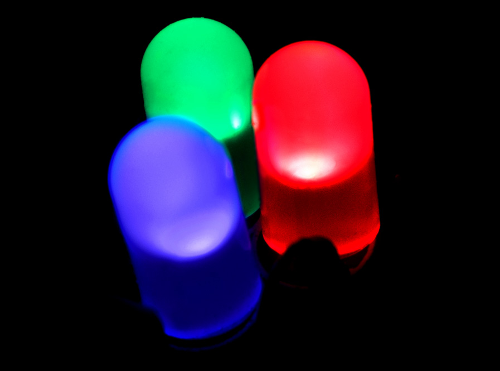
The most basic output indicator from an Arduino is an illuminated LED (light-emitting diode). We assign a meaning to various lights: from traffic signals to lights that indicate the power is on for a device. For a set of lights to convey a specific meaning there must be a strong context; like a railroad crossing.
Seven-Segment LEDs
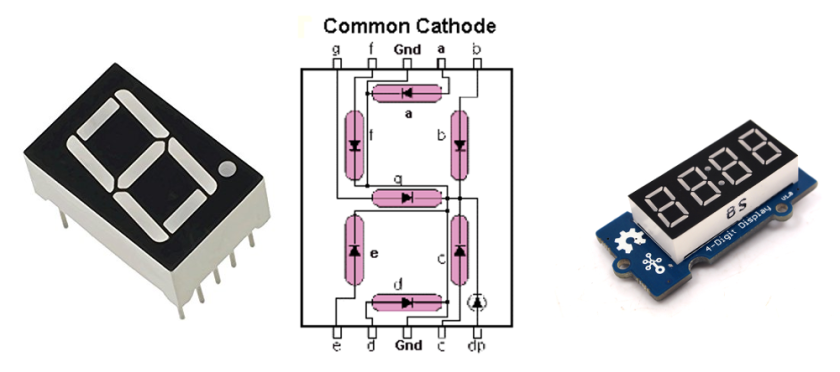
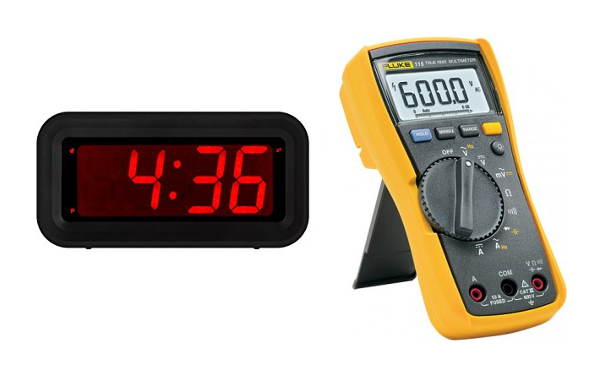
Much more information can be displayed if the LEDs are arranged in seven segments to display the numbers 0-9. 7-Segment LEDs may be arranged in a row to display hours and minutes for a clock or numbers, as often found on a digital voltmeter.
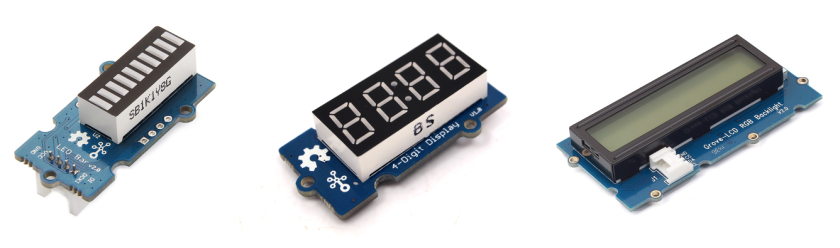
Grove Bargraph Display
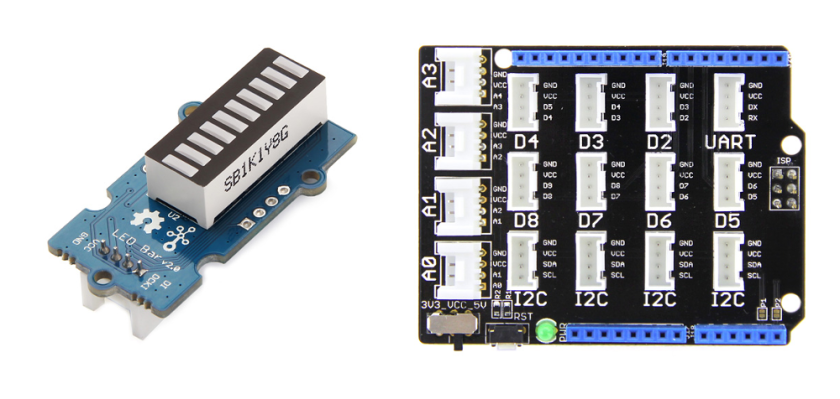
Get the Grove bar graph display and connect it to the Grove shield using a Grove cable to port D8. This device requires a special library which we have already installed.
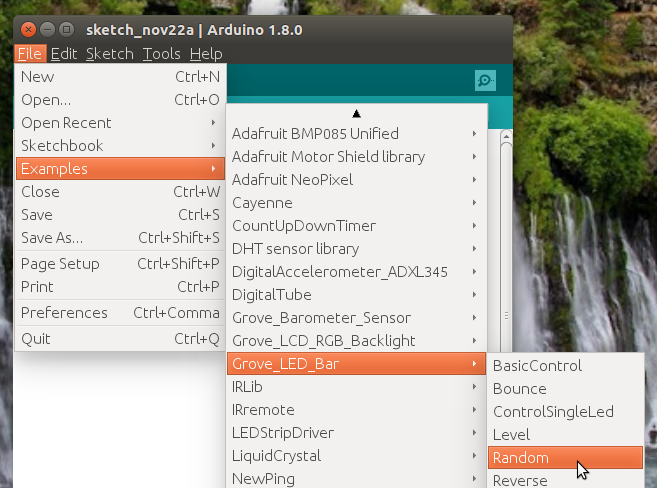
Open the example code Grove_LED_Bar/Random and run it.
/*
Grove LED Bar - Random Example
This example will show you how to use setBits() function of this library.
Set any combination of LEDs using 10 bits.
*/

#include <Grove_LED_Bar.h>

Grove_LED_Bar bar(9, 8, 0); // Clock pin, Data pin, Orientation

void setup()
{
// nothing to initialize
bar.begin();
}

void loop()
{
// Display a random value between 0 (all LEDs off) and 1023 (all LEDs on)
bar.setBits(random(1024));
delay(50);
}
Note the use of the random function. It generates pseudo-random numbers for the range in the parenthesis “()”. This is great for a movie prop; but it is not displaying any real information.
Modify the Code to Display Meaningful Data

//Connect bar graph to D8 and the light sensor to A0

#include <Grove_LED_Bar.h>

Grove_LED_Bar bar(9, 8, 0); // Clock pin, Data pin, Orientation

void setup()
{
// nothing to initialize
bar.begin();

}

void loop()
{
// read the input on analog pin 0:
int sensorValue = analogRead(A0)/30;
delay(200);
bar.setLevel(sensorValue);
}
Connect the light sensor to port A0. You can either modify the original code or you may cut and paste the code above into a blank sketch. From our previous project on sensors I knew the range of output for that sensor was 0 to @300; do I divided the raw sensor data by 30 to get a range of 0 to 10 for the bar graph display. Run the sketch and observe the display while you cup your hands around the light sensor to see the change in bar display. If you have trouble uploading the sketch unplug the bar graph display temporarily; I have observed this; not sure why.
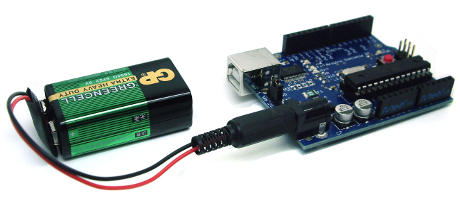
Another oddity I observed is that after a while; the LED bar graph display pegs to all LEDs on and will not go back low even with pressing the reset button on the Arduino. When I power the Arduino from a 9V battery (your kit has this adapter) this does not happen; which leads me to believe the sensor gets glitched through noise spike on the mains power. This is the nature of nature of electronics exploration and programming: finding and resolving bugs. I am still working on it; when i find a solution I will update this blog.
LCD Display with RGB Backlight
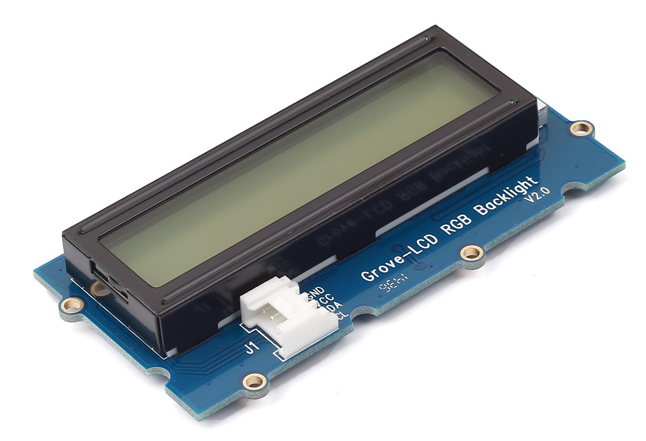
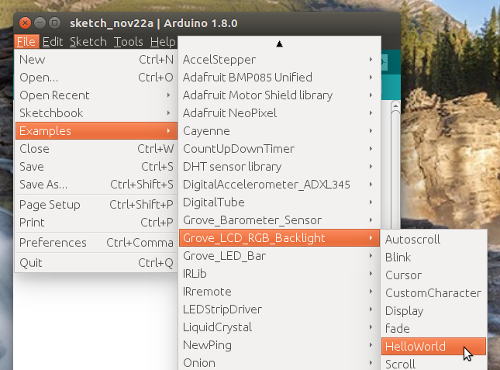
Open the example sketch “Grove_LCD_RGB_Backlight/HelloWorld.
#include <Wire.h>
#include "rgb_lcd.h"

rgb_lcd lcd;

const int colorR = 255;
const int colorG = 0;
const int colorB = 0;

void setup()
{
// set up the LCD's number of columns and rows:
lcd.begin(16, 2);

lcd.setRGB(colorR, colorG, colorB);

// Print a message to the LCD.
lcd.print("hello, world!");

delay(1000);
}

void loop()
{
// set the cursor to column 0, line 1
// (note: line 1 is the second row, since counting begins with 0):
lcd.setCursor(0, 1);
// print the number of seconds since reset:
lcd.print(millis()/1000);

delay(100);
}
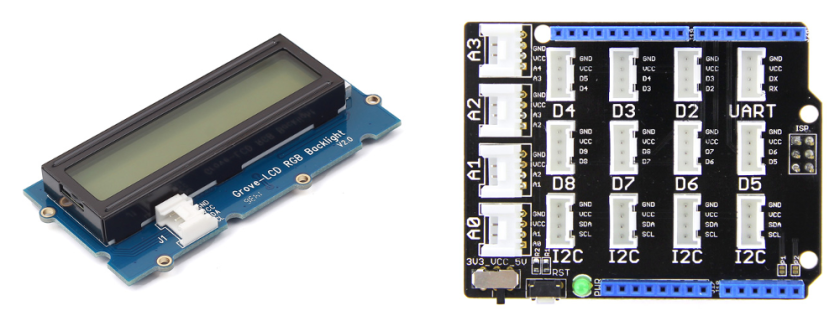
This LCD display uses a special chip-to-chip serial protocol called ‘I2C’ (pronounced ‘eye-two-see’). Plug the LCD display into any if the I2C connections on the Grove shield.
Run the sketch and observe the LCD display. It prints “Hello, world!” on the first row and on the second it counts the seconds since it was last booted.
Change this section of code to:
const int colorR = 0;
const int colorG = 255;
const int colorB = 0;
And reload the sketch. The red backlight should have changed to green. With different combinations of RGB (reg, green, blue) numbers any color of the rainbow is possible. Play to your heart’s content.
Now let us make it personal b y replacing the text “Hello world!” with your name.
// Print a message to the LCD.
lcd.print("hello, James");
Let us really modify the sketch to make a
Classroom Noise Monitor
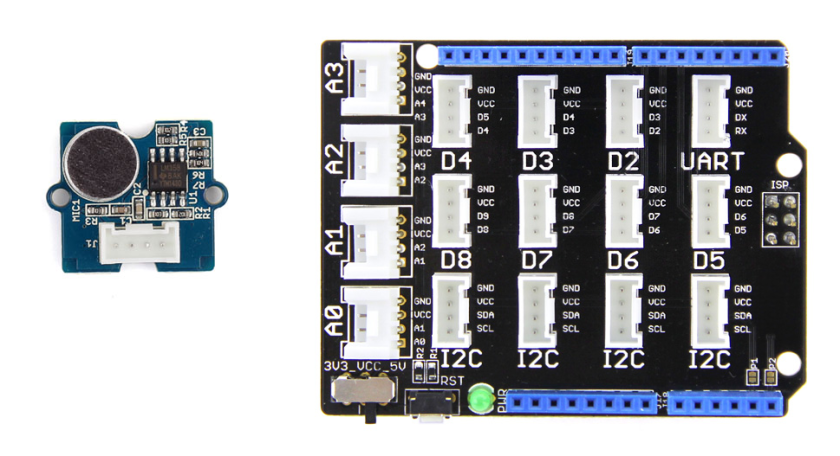
Get the Grove sound sensor and plug it into A0. Leave the LCD display connected to the I2C port.
Either modify your existing sketch or cut and paste the code below into a blank sketch:
//Connect sound sensor to A0 and LCD display to any I2C port

#include <Wire.h>
#include "rgb_lcd.h"

rgb_lcd lcd;

const int colorR = 255;
const int colorG = 255;
const int colorB = 0;

void setup()
{
// set up the LCD's number of columns and rows:
lcd.begin(16, 2);
lcd.setRGB(colorR, colorG, colorB);

}

void loop()
{
// read the input on analog pin 0:this is the sound sensor
int sensorValue = analogRead(A0);
// set the cursor to column 0, line 0
// (note: line 0 is the first row, since counting begins with 0):
lcd.setCursor(0, 0);
// Print a message to the LCD.
lcd.print("I am listening");
delay(1000);

// set the cursor to column 0, line 1
// (note: line 1 is the second row, since counting begins with 0):
lcd.setCursor(0, 1);
if (sensorValue > 30) {
// print a warning
lcd.print("Be Quiet!");
}
delay(1000);
// clear the screen
lcd.clear();
}
Run the sketch and observe the LCD display while whistling or making some noise.
Do This At Home

Think of some Arduino projects you would like to do using these displays. If you want to do these at home; remember to Google the exact type of display and install the libraries. I found them at:
Grove RGB LCD https://www.seeedstudio.com/Grove-LCD-RGB-Backlight-p-1643.html
Grove Bar Graph https://github.com/Seeed-Studio/Grove_LED_Bar
